U.S. hotel occupancy rises to 50.5% in early January
CoStar data showed gains in U.S. hotel occupancy, room rates and RevPAR for the week ended Jan. 3, while early-year readings remain hard to assess.
By Ingrid Halvorsen · Venture Capital Reporter
· 2 min read
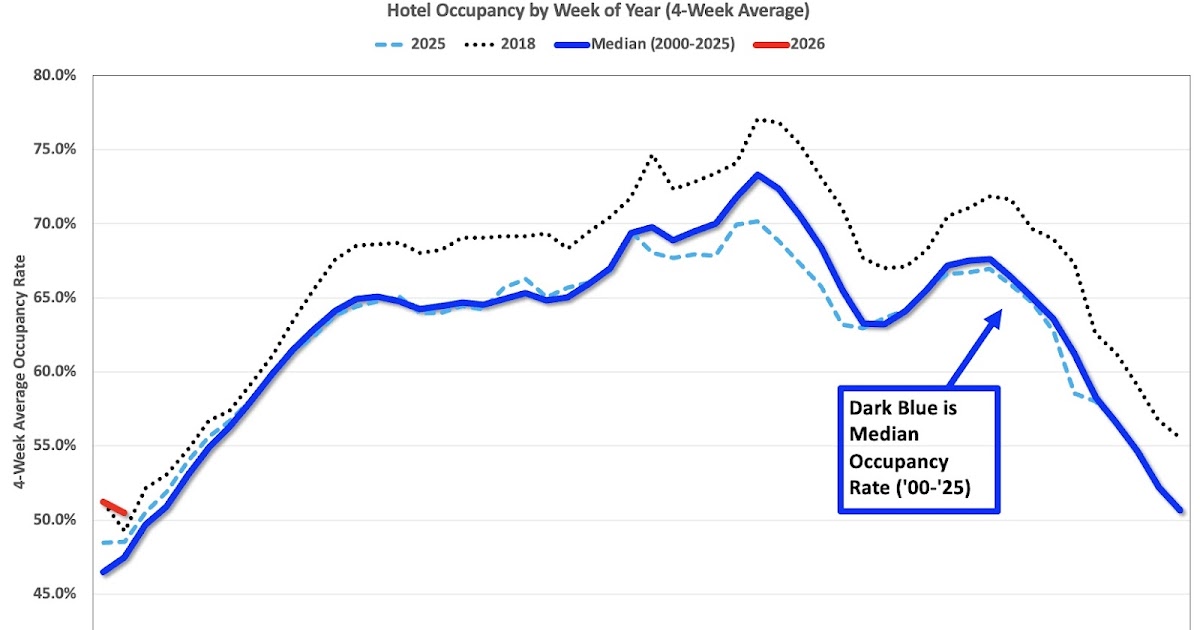
U.S. hotels reported stronger year-over-year operating figures in the week ended Jan. 3, with occupancy at 50.5%, up 4.4% from the comparable week, according to CoStar data cited by STR. Average daily rate rose 3.4% to $175.47, while revenue per available room increased 7.9% to $88.65, giving operators a higher revenue measure at the start of the year.
The figures cover the period from Dec. 28, 2025, through Jan. 3, 2026. CoStar said the U.S. hotel industry posted positive year-over-year comparisons across the three reported measures.
Occupancy measures the share of available hotel rooms that are filled. Average daily rate, or ADR, tracks the average price paid for occupied rooms. Revenue per available room, known as RevPAR, combines occupancy and pricing, so it can rise when hotels sell more rooms, charge higher rates, or both.
The latest report showed gains on both the volume and pricing sides of the business. The 4.4% occupancy increase indicates more rooms were filled than in the comparable year-earlier week, while the 3.4% ADR gain points to higher room pricing. Together, those moves produced the larger 7.9% rise in RevPAR.
Calculated Risk, which follows real estate and economic indicators, said hotel occupancy was weak in 2025. It also cautioned that early-January data can be difficult to read because travel is seasonally soft at the start of the year.
The site presented a hotel occupancy chart using a four-week average to show the seasonal pattern. In that chart, 2026 was shown in red, the median in blue, 2025 in dashed light blue and 2018 in dashed black. Calculated Risk identified 2018 as the record year for hotel occupancy.
Calculated Risk said the chart’s vertical axis did not begin at zero, a design choice intended to make seasonal movements more visible. It added that the four-week average is expected to rise seasonally over the next few months.
The early-year improvement therefore offers a positive first reading for the lodging sector, but the data carry the usual seasonal caveat. CoStar’s weekly hotel indicators show a better comparison than the prior year, while Calculated Risk’s analysis emphasizes that the first weeks of January are not enough to judge the trajectory of the year.
This story draws on original reporting from Calculated Risk.