US household net worth rose $6.1 trillion in third quarter
Federal Reserve data showed wealth gains were led by equities, while real estate values declined and household borrowing grew at a 4.1% annual rate.
By Sarah Jenkins · Chief Macro Economics Correspondent
· 3 min read
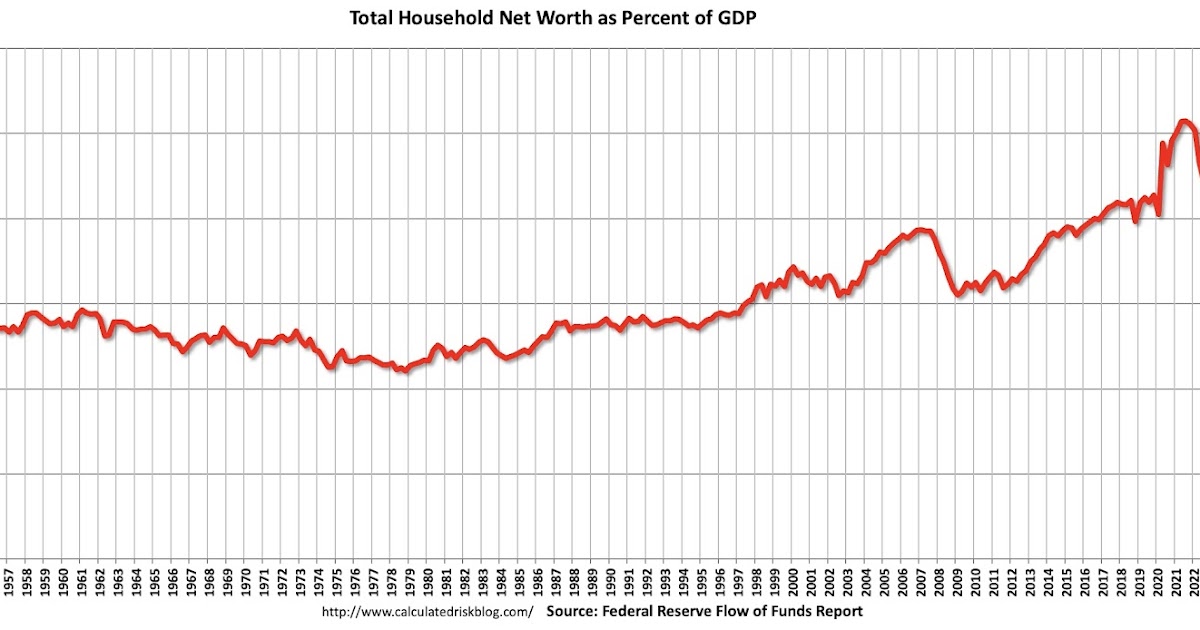
US household and nonprofit net worth increased by $6.1 trillion in the third quarter of 2025, reaching $181.6 trillion, according to the Federal Reserve’s Financial Accounts of the United States released on Jan. 9. The gain was concentrated in corporate equities, whose directly and indirectly held value rose by $5.5 trillion, while real estate values fell by $0.3 trillion.
The figures point to a quarter in which market-priced financial assets outweighed weakness in housing-related wealth measures. The Federal Reserve’s data also showed household debt expanding at a 4.1% annual rate, with consumer credit rising at a 2.3% annual rate and mortgage debt, excluding charge-offs, increasing at a 3.2% annual rate.
The Financial Accounts, often referred to as the Flow of Funds report, track the balance sheets of households, businesses, governments and financial institutions. For households and nonprofit organizations, net worth is calculated as the value of assets such as real estate, equities, bonds, pension reserves and deposits, minus liabilities, which are largely mortgage-related. Calculated Risk noted that this measure does not include public debt obligations.
As a share of gross domestic product, household and nonprofit net worth rose in the third quarter, according to Calculated Risk’s analysis of the Federal Reserve data. That ratio remained below its 2021 high, a reference point that followed the sharp rise in asset prices during and after the pandemic period.
Housing equity eased, but remained high
The housing portion of the household balance sheet showed a more mixed picture. Calculated Risk reported that household equity in real estate, as measured by the Federal Reserve, stood at 71.6% in the third quarter, down from 72.0% in the second quarter of 2025. The measure includes households that have no mortgage debt.
Household equity in real estate represents the portion of housing value not backed by mortgage liabilities. A higher equity share generally indicates that homeowners collectively have more unencumbered value in their properties, while a lower share can reflect rising mortgage balances, falling home values or both.
Calculated Risk noted that the equity share fell sharply during the 2007 and 2008 housing downturn, when home prices declined steeply. The third-quarter 2025 reading remained far above those stressed-period levels, based on the historical series described in the analysis.
Mortgage debt rose in dollar terms
Mortgage debt increased by $108 billion in the third quarter, according to Calculated Risk’s review of the Federal Reserve data. The level of mortgage debt was $2.99 trillion above its peak during the housing bubble.
Relative to the size of the economy, however, mortgage debt was lower than in prior stress periods. Calculated Risk said mortgage debt equaled 43.9% of GDP in the third quarter, down from the second quarter and well below the 73.1% peak reached during the housing bust.
The value of household real estate as a share of GDP also declined in the quarter, according to Calculated Risk. That measure remained below its recent peak in the second quarter of 2022, while staying well above the median level recorded over the past 30 years.
The Federal Reserve release showed that the composition of household wealth remains sensitive to asset-market performance. In the third quarter, equity gains drove the overall increase in net worth, while real estate contributed a drag and household liabilities continued to expand at a moderate annualized pace.
This story draws on original reporting from Calculated Risk.